Authors:
(1) Michal K. Grzeszczyk, Sano Centre for Computational Medicine, Cracow, Poland and Warsaw University of Technology, Warsaw, Poland;
(2) M.Sc.; Paulina Adamczyk, Sano Centre for Computational Medicine, Cracow, Poland and AGH University of Science and Technology, Cracow, Poland;
(3) B.Sc.; Sylwia Marek, Sano Centre for Computational Medicine, Cracow, Poland and AGH University of Science and Technology, Cracow, Poland;
(4) B.Sc.; Ryszard Pręcikowski, Sano Centre for Computational Medicine, Cracow, Poland and AGH University of Science and Technology, Cracow, Poland;
(5) B.Sc.; Maciej Kuś, Sano Centre for Computational Medicine, Cracow, Poland and AGH University of Science and Technology, Cracow, Poland;
(6) B.Sc.; M. Patrycja Lelujko, Sano Centre for Computational Medicine, Cracow, Poland;
(7) B.Sc.; Rosmary Blanco, Sano Centre for Computational Medicine, Cracow, Poland;
(8) M.Sc.; Tomasz Trzciński, Warsaw University of Technology, Warsaw, Poland, IDEAS NCBR, Warsaw, Poland andTooploox, Wroclaw, Poland;
(9) D.Sc.; Arkadiusz Sitek, Massachusetts General Hospital, Harvard Medical School, Boston, MA, USA;
(10) PhD; Maciej Malawski, Sano Centre for Computational Medicine, Cracow, Poland and AGH University of Science and Technology, Cracow, Poland;
(11) D.Sc.; Aneta Lisowska, Sano Centre for Computational Medicine, Cracow, Poland and Poznań University of Technology, Poznań, Poland;
(12) EngD.
Table of Links
Conclusion, Acknowledgment, and References
Results and Discussion

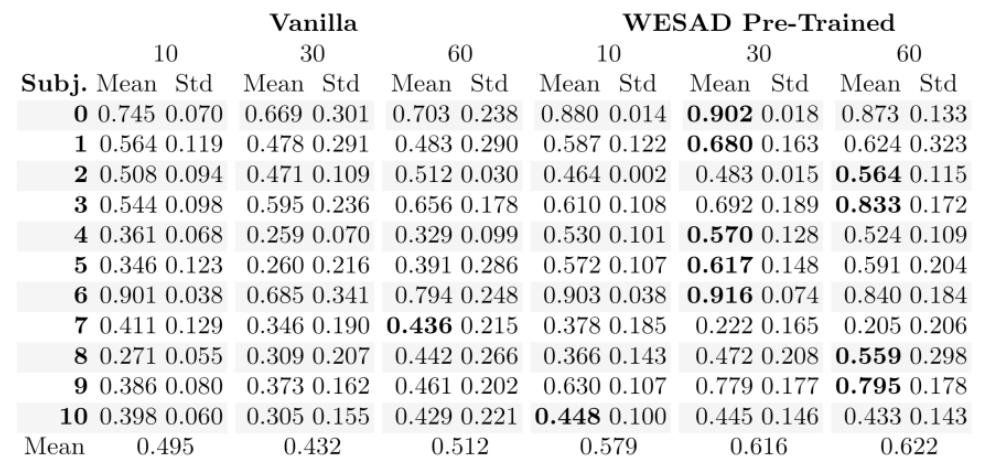
Cognitive Load Detection. To understand how to obtain a reliable cognitive load detection model we investigate different approaches to training protocols including varying lengths of the signal input and model pretraining as described above. Due to a small number of data, the model performance was varying between runs and therefore we run each training session 40 times and report the mean and standard deviation of all runs. We find that the number of data samples was insufficient to train the model from scratch on the pilot cognitive load dataset only (see Vanilla in Table 1). Model pre-training on WESAD dataset has shown to be helpful for cognitive load detection (see WESAD pre-trained in Table 1). The length of the signal is also important, in general, the 10 seconds window seems to be insufficient to obtain promising cognitive load detection performance even when the model is pretrained.
We expected that the better the performance of the stress detector on the pretraining task the better will be the performance on the fine-tuning task. However, the link between source and target task performance is not that apparent. There is a weak correlation between source training data stress detection and fine-tuned cognitive load detector performance (r=0.18 p=0.04), a slightly stronger correlation between source validation data stress detection and target cognitive load detection (r=0.25, p=0.005), and no correlation between the test subject stress detection and target dataset cognitive load score (see Figure 3). Further, to check if our cognitive load detector is not just detecting stress, we run the best-performing stress detector with a 30s window on all participants from the pilot dataset and check % of samples for each participant from each condition (baseline and cognitive load) that are classified as stressed. We find that signal from participants 1, 3, 4, 7 and 8 had 0 samples classified as stressed, participants 0, 6, 9 and 10 had 9-22% samples classified as stressed and only participants 2 and 5 showed higher levels of stress with 59% and 55% of signal classified as stressed respectively. This suggests that improvements obtained via pre-training are not due to the physiological signal similarity in both conditions (cognitive load is not classified as stress) but rather due to learning of general feature extraction from the 1D signal.

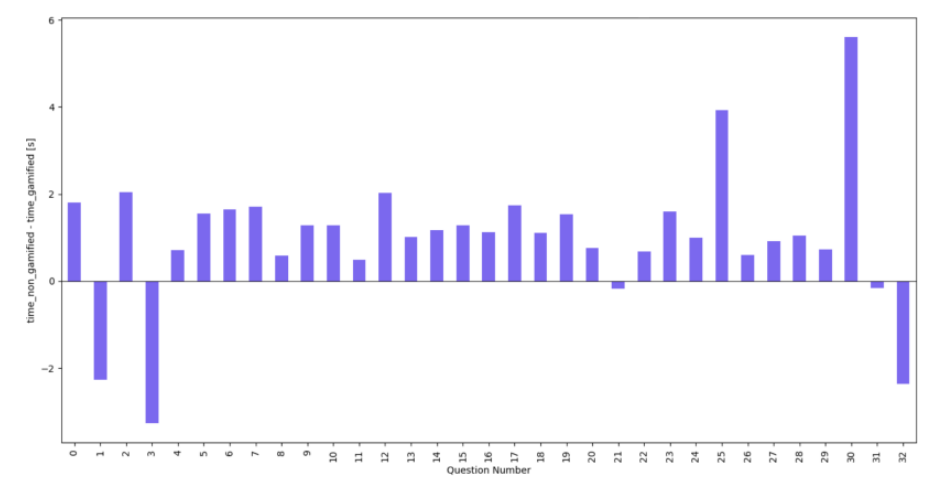
Response Time. On average participants spent less time responding to questions in gamified condition than in Non-gamified condition, with 5.5s and 6s per question respectively. However, interestingly, in gamified condition participants spent more time at the start and end questions which potentially could be due to the introduction of the gamified components which could capture respondents' attention (see Figure 4). Note that time spent on the very last question in each survey has been not included in this analysis as they mostly capture the time needed to move between questionnaires.


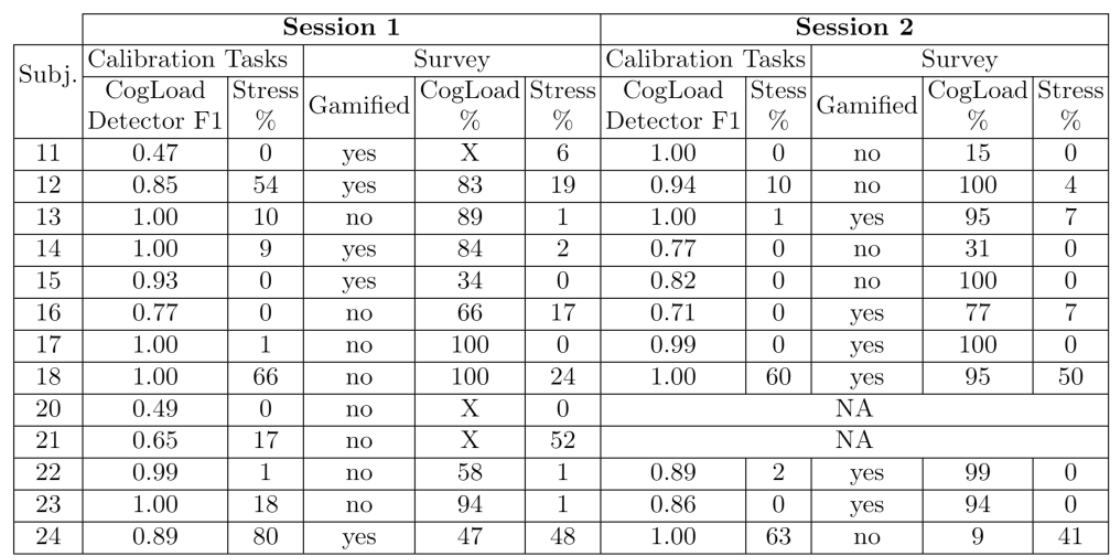
Cognitive Burden. To ensure that the cognitive load detector can distinguish between high and low cognitive load for each participant in the survey dataset we first applied all 440 models (from 40 runs and 11 folds) trained with a 30s window on the pilot dataset to every participant in the survey dataset in cognitive load and baseline conditions and for each participant, we selected a model showing the best performance for this participant. In other words, we matched the models to participants using a small calibration dataset obtained from participants prior to filling the survey application. The performance of the selected best model is reported in Table 2 for each session. We have excluded the prediction of cognitive load during survey completion for those participants for whom we could not get a model with performance above 0.7 F1 score (marked with X in Table 2). Encouragingly, for 10 out of 13 participants, we were able to find a model which could reliably distinguish between their high and low cognitive load. The time spent in the high cognitive load and stress does not differ between gamified and non-gamified survey conditions. Potentially to understand if there is a difference between cognitive burden we would need a classifier trained on at least three different tasks with cognitive load levels: high (demanding task), medium (e.g. reading task) and low.
Participants Experience. Only half of the participants noticed the difference in survey application appearance between the sessions. Participants who noted the difference reported preferring the gamified version more. Potentially the gamification was too simplistic to modulate the level of engagement or enjoyment. It is nontrivial to introduce game components in the surveys to reduce the burden but not affect the responses.
This paper is available on arxiv under CC BY 4.0 DEED license.

